
A balanced view of an emotive subject?
Introduction
‘How Americans see automation and the workplace in 7 charts’
Well, a snappy and concise title. (and yes…. there are 7 charts).
So what is the author of this article trying to achieve?
The article investigates an American view of what technological automation and the workplace could be like, or how automation could impact the job landscape. The article pulls together two pieces of research published by the Pew Research Centre that have examined the considered possible job landscape; these being ‘Looking to the future; Public sees an America in decline on many fronts’ published in 2019 and ‘Automation in everyday life’ published in 2017
So is the author trying to foretell the future? Not really. But maybe the author is trying to convey what the average American thinks may happen with technological automation and the job landscape in decades to come.
And who are Pew? The Pew Research Centre describes its self as a nonpartisan fact tank, with the objective to inform people about issues, attitudes and trends that could be shaping the world. They conduct public opinion polling, demographical research, media content analysis and other empirical research, and publish results.
So why am I analysing this report? Why am I not discussing the two articles that this article is based upon? To answer that question – this article was cited in my last blog where I discussed an investigation that examined the differences between the sociodemographic groups, perceived job security and technological automation within the Atlanta Metro Region in the USA, and although this article is a summary, I felt it important to investigate the original reports that this summary was based upon, therefore indicating the flow of the statistics highlighted.
Discussion
The author is A.W. Geiger, a former Associate Digital Producer/Writer for the Pew Research Centre, and has covered a diverse set of subjects from Marijuana, to key findings of the news landscape in America, depression in teenage girls, 8 facts about marriage, and congress in 6 charts – to name a few.
Now we have an idea about the author, but what are the 7 charts? And what are they going to tell us? Well, let’s have a look.
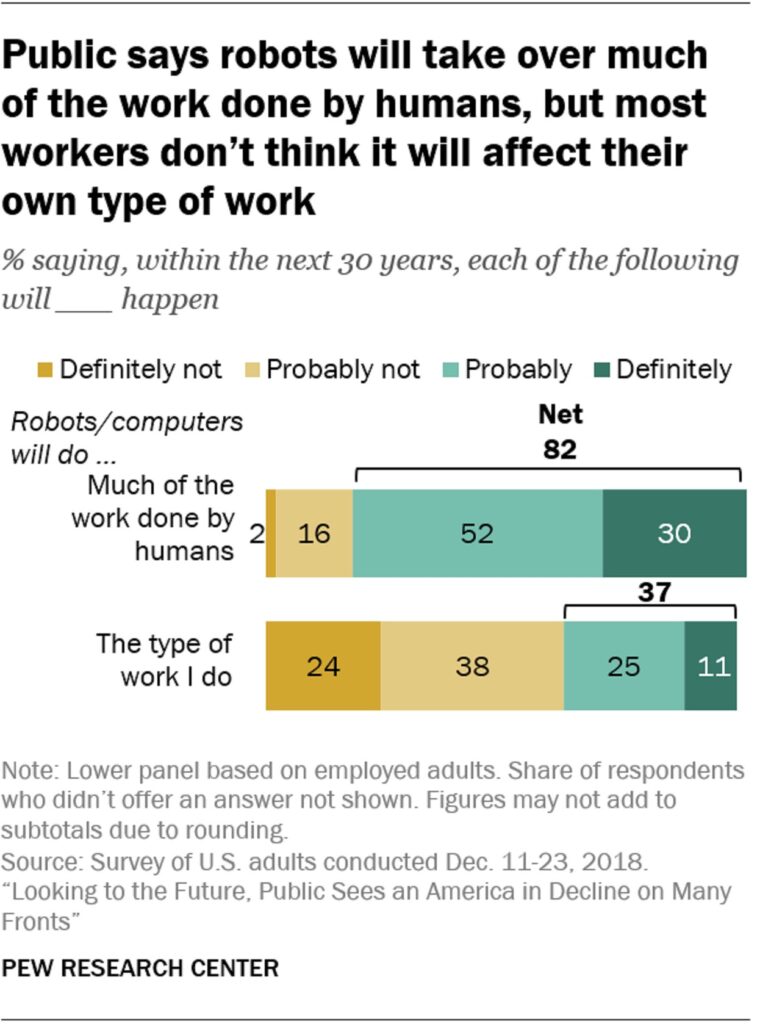
Chart 1, discusses the future of automation through the statement ‘Most Americans anticipate widespread automation in the coming decades’. The article summarises the original Pew research ‘Looking to the future: Public sees an America in decline on many fronts’ that indicates that 82% of adults believe that computers and/or robots will definitely or probably do much of the work done by humans now, with 37% of those surveyed indicating that they believe that their jobs will be automated by 2050.
Well, that is a bombshell to start with! However, this is something that should be considered within the context of this article and the original Pew research, neither of them makes any distinction between robotic or computer-based automation when it comes to the automation of a job.
From the chart shown within the original Pew report,
It indicates that 40% of Americans surveyed say technological automation, through either robotics or via computers, will be a ‘bad thing’ with 29% saying it will be a ‘very bad thing’.
But let’s break this down, as these statistics are not that simplistic. The original Pew report indicates that education level impacts the workers’ perceptions of technological automation and any risks to their jobs, (this was also implied in the research carried out in the Atlanta Metro Region that was examining technological automation and jobs, examined in my last blog).
This perception of threat is indicated by 47% of workers with a high school diploma or less believe that it is more likely that they will be replaced and that their work will be done by robots or computers in the future (2050), the research also indicates that 38% of workers with some college education, and 27% of workers with a b\achelors degree or higher educational attainment also believe that it is more likely that they will be replaced and that their work will be done by robots or computers in the future (2050).
Chart 2 discusses technological automation optimism/pessimism through ‘The US public generally anticipates more negative than positive effects from widespread automation’
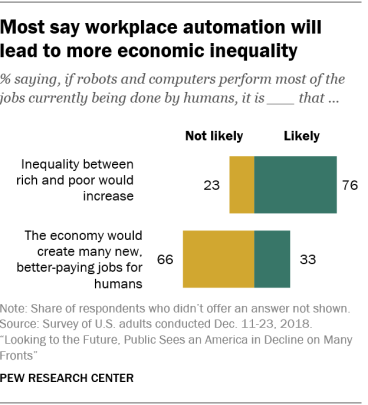
This is another part of the Pew report ‘Automation in everyday life’ and indicates that 76% of the Americans surveyed believe that inequality will increase with the introduction of technological automation with most jobs being completed by computers or robots by 2050, however, and this was not highlighted in the article and was taken from the same original article that 25% of those surveyed indicate a positive impact by the creation of new and better-paid jobs.
This article continues discussing through chart 2 the original Pew report indicates that 1 in 4 (75%) of Americans consider the U.S economy would become more efficient, with the continued introduction of technological automation enabling workers to focus on things that are more important to them, including charity, family, or education.
So from the initial bombshell that the general perception is negative, Americans can see some possible positive impacts. In fact, depending on the question posed, we see similar statistics describing both negative and positive perceptions (76%/75%).
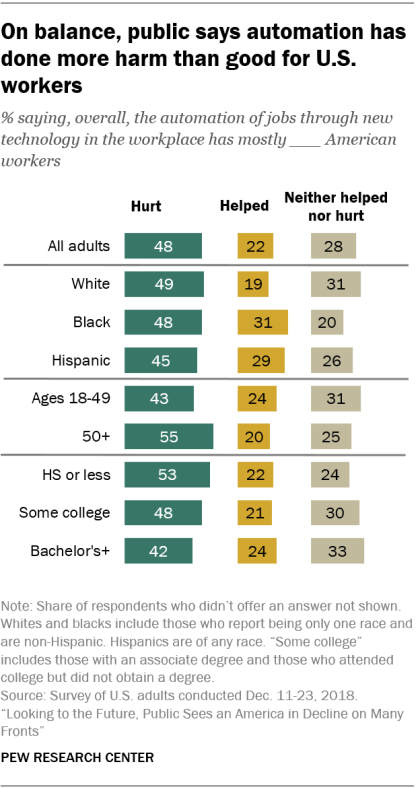
Chart 3 again discusses optimism/pessimism ‘When it comes to where workplace automation that has already occurred, Americans are more likely to say that it has hurt American workers than helped them’, originally sourced from the pew report ‘Looking to the future: Public sees an America in decline on many fronts’. Let’s start with the chart, the author highlights the top statistic that 48% of those questioned indicated that automation has mostly hurt American workers, 22% indicate it has generally helped, with a further 28% indicating that automation has neither helped nor hindered.
The author then continues to discuss participants over the age of 50 indicating that 55% perceive that automation will hurt jobs, and 53% of participants that do not have a Bachelor’s degree or more indicating that jobs will be hurt.
This might imply that the older the worker or the less education they have received, the higher the percentage of negative perceptions towards workplace automation.
However that is where the author stops, but the original chart as seen breaks down the sociodemographics, and all of these ethnic minorities, or educational attainment levels have different perspectives on the threats caused by technological automation.
But these are the negative statistics! Where are the positive numbers? Are there any positive numbers? Well to be quite honest there do not seem to be. However, the author misses some very important points that although not mitigating the generally negative outlook, they do indicate that the negativity is countered by some neutrality.
33% of participants with bachelor’s degree or above consider that the impact is neither positive nor negative, with 30% of participants with a college education consider technological automation neither a positive or negative influence.
Chart 4 discusses ‘Americans think automation will likely disrupt a number of professions, but less likely to foresee an impact on their own jobs’ This is an interesting chart, taken from the original Pew report ‘Automation in everyday life’. highlighting the strong positive and negative statistics, but misses some interesting points.
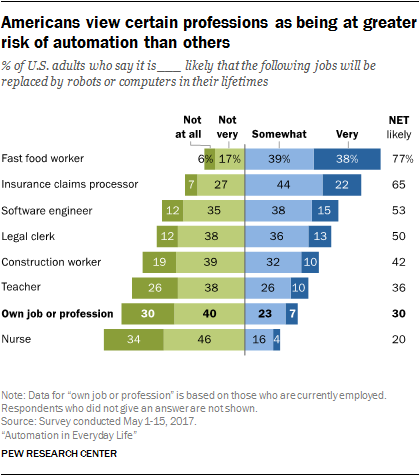
The chart examines seven occupations that could be more or less susceptible to automation, however, the author does not mention the fact that the seven occupations are the only ones surveyed within the original Pew research.
For example – the author shows that 77% of the survey participants indicate that fast-food workers and 65% of Insurance processors are susceptible to technological automation within their lifetimes. The author then proceeds to indicate that through the statement’ while smaller shares said it would affect construction workers, teachers or nurses.
The original Pew report indicates that 20% of nurses, 30% of the self-employed and 36% of teachers could have their occupations automated within their lifetimes, and this put a different spin on the article.
What is the author trying to get across through this chart? That some occupations or jobs will become automated, or that some will? The original Pew report continues to discuss the differences between cognitive and physical or routine and non-routine occupations, which the author does not do and these factors have a direct impact on the possibilities of the job or occupation being automated.
The authors summary of this chart could therefore be seen as limited at best and flawed at worst.
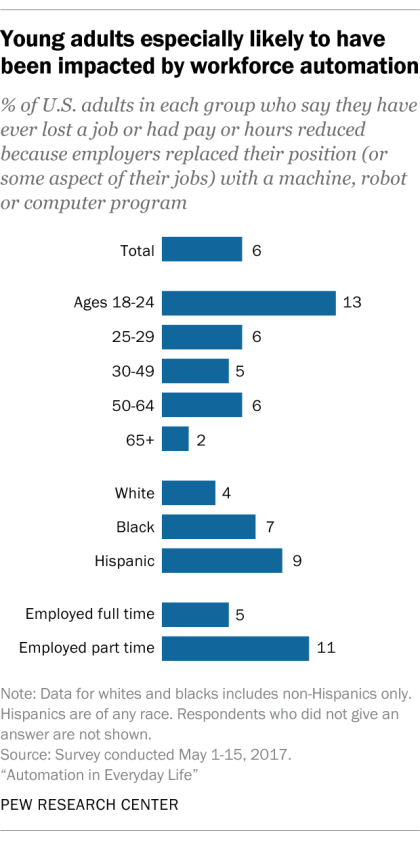
In Chart 5 the author highlights some of the key aspects of the graph ‘Young adults and part-time workers are especially likely to be affected by workforce automation’. From the original Pew report ‘Automation in everyday life’.
The author highlights from the chart workers between the ages of 18 to 24 have either had hours reduced or lost jobs dues to technological automation, and part-time workers are slightly more at risk of losing their job due to technological automation.
The author again misses some of the subtleties of the research, as the chart also indicates that blacks and Hispanics are more likely to be impacted by technological automation.
The author discusses through Chart 6 the position of possible U.S federal policies that could limit the introduction of technologies, as a way of protecting jobs and occupations, ‘Many Americans say there should be limits on job automation’.
This chart is again based on the original Pew research ‘Automation of Everyday life’ that investigated 4 proposed policies that could mitigate or manage the introduction of technological automation.
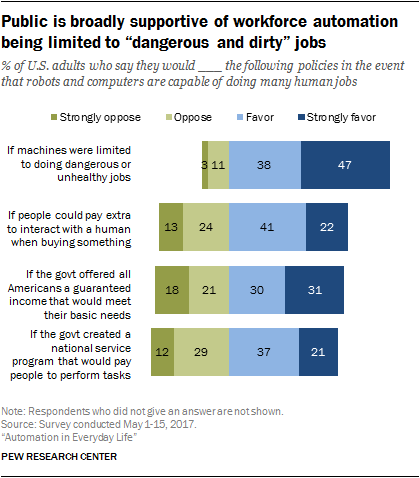
The Author discusses three statistics specifically; the limiting of machines to complete unhealthy or dangerous jobs of which 85% of Americans surveyed agreed with, and 60% agreed with the introduction of a universal income and 58% indicated that they agree with the introduction of the policy of paying people to complete tasks, even if they can be performed faster or cheaper with automation.
However, the author does not discuss the survey participants that oppose the introduction of the universal income, or the impact of political affiliation or education attainment on the introduction of the universal income, or the use of technological automation to complete hazardous or dangerous jobs.
Chart 7 discusses who would be responsible for looking after the displaced workers through the statement ‘Americans divided of responsibility of taking care of displaced workers in the event of far-reaching job automation’.
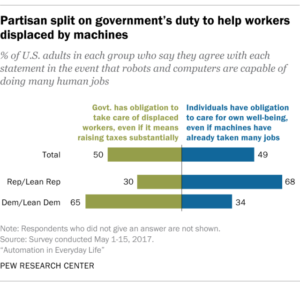
The author summarises another section of the Pew report ‘Automation in Everyday life’ citing that 50% of Americans surveyed believe the federal government should be responsible and take care of the workers who have been displaced by the introduction of technological automation.
The author continues by indicating the differences in political affiliation, and they can impact on the expectancy for the federal government to introduce a policies to take care of displaced workers, 65% Democrats (Labour in the UK) advocate the introduction of policies versus 34% Republican (Conservative in the UK), that do not advocate the introduction of policies
However, the statistics are not that simple (they never are!). The Pew report further discusses limits placed on technological automation within businesses with 41% indicating that those with higher educational attainment perceive that there should not be limits placed on business, with 60% that are less educated indicating that there should be limits.
Conclusions
This is a quick-read article using some good charts that could be seen as an indicator of American attitudes towards technological automation and its possible impacts. It could be considered to be useful if a little biased against technological automation, but this is an emotive subject and one that can and will impact millions of people globally not just American workers.
However, when I read any published works I try to identify any positive or negative bias to technological automation. Myself – I feel positive, but then again I would because I have worked in the IT industry for over 30 years, and although I believe that jobs may be changed and some even lost, new jobs will be created, as I have seen in my working life.
So what bias does this article have, if any? In my mind, this article has a slightly negative bias, not in what the author is saying but in which statistics are highlighted.
The author does not explain or add to the discussion about the charts selected, or indeed defines the context or environments (politically, educationally, age, gender, ethnicity, etc are noted but in a very limited way) in which the research was carried out.
Yes, this is a summary article, aimed at the general public, however, there are additional statistical factors that may be accounted for contained within the original Pew reports and the charts presented within them, but were not highlighted within the summary, and this I feel is an opportunity missed to provide a more balanced view of the statistics
This can be seen with the first chart, and wow – that is a scary one. 82% of the Americans surveyed indicated that their jobs will definitely or probably be replaced by robots or computers.

But we have to take into account that the research is looking for responses and perceptions from the workers that account for the next 30 years of technological automation and the workplace. And well, the original research breaks down those numbers, and this indicates that education plays an important part of those perceptions.
So, all in all, yes it could be seen as an important article in that it introduces an emotive subject to the wider public. However, I believe the author could have represented a more balanced view of the statistics, by including some of the additional information contained within the original reports,
Nevertheless, it is an interesting read.
Bibliography
‘Americans and Automation in Everyday Life’. Pew Research Center: Internet, Science & Tech (blog), 4 October 2017. https://www.pewresearch.org/internet/2017/10/04/automation-in-everyday-life/.
‘Americans’ Attitudes about a Future Where Robots and Computers Do Many Human Jobs’. Pew Research Center: Internet, Science & Tech (blog), 4 October 2017. https://www.pewresearch.org/internet/2017/10/04/americans-attitudes-toward-a-future-in-which-robots-and-computers-can-do-many-human-jobs/.
‘How Americans See Automation and the Workplace in 7 Charts’. Pew Research Center (blog). Accessed 16 October 2020. https://www.pewresearch.org/fact-tank/2019/04/08/how-americans-see-automation-and-the-workplace-in-7-charts/.
Next Blog
The start of a new journey (jaunt)……………….