Examining Perceptions of Threat
or
‘Who perceives automation as a threat to their jobs in the Metro Atlanta Area’?
‘Results from the 2019 Metro Atlanta survey’
Introduction
Atlanta Georgia in the southern United States has for the last few years performed a survey where they ask randomly selected residents within the 10 counties of the city of Atlanta to answer a survey that covers multiple topics. Their diverse questionnaire includes; housing, zip code, salary band, transportation, ethnicity, education level and employment status, to name only a few.
Examining Perceptions of Threat
So why is this examination of threat perceptions so important?
Well, Ramish Ghimire, (University of Georga), and Jim Skinner, Mike Carnathan (Atlanta Regional Commission) researched the sociodemographic characteristics of employed residents and their perception of technological automation as a threat to their jobs within the Atlanta Metro region.
And latterly published the article ‘Who perceives automation as a threat to their jobs in the metro Atlanta: Results from the 2019 Metro Atlanta survey’.
The research authors wanted to examine the demographics of the residents of the Atlanta Metro region to understand if there were differences between sociodemographic diverse families and their perceived threat of technological automation.
Discussion
So why was this research done? What did the authors wish to discover? What use could this information be?
As those of you that have been following my blog will know, my MSc thesis was on the perceptions of job security in light of the potential threat of technological automation. This information can be useful and applicable in the real world. By understanding the potential perceptions, adjustments can be made to mitigate the reactions employees could have to those perceptions.
The authors of the research this blog is exploring identified that Atlanta Metro region could be observed as the economic capital of the southeast region of the USA, with 26 Fortune 500 companies citing organisational headquarters within the city (Corporate Editors, 2020), and due to these organisations the Atlanta Metro region could be viewed as investment-friendly.

The authors also cite that the Altlanta Metro region has a larger percentage of younger residents.
The residents of the Atlanta Metro region have been categorised as 36% being under 35, with 60% being between the ages of 36 – 60 and the remaining 4% being identified as over 65 in 2018.
The educational status of the workers within the Atlanta Metro region has been described as 28% have a high school education or less education, with 29% having some college or associate degree and 48% having a bachelor’s degree or more.
Demographically 44% of the workers are white, with 36% describing themselves as African Americans and 11% describing themselves as Hispanics or Latinos with 9% describing themselves as other race or ethnic groups. The gender split indicates an approximate even split 52% male and 48% as female (Corporate Editors, 2019).
Why are these statistics important? They indicate that the workforce available within the Atlanta Metro region could be considered to be diverse across race, age, and education and with an approximately equal share between genders.
For those of you that don’t know Atlanta (and I include myself in this), the I-20 freeway splits the Atlanta Metro region into two – these being north and south. Now like many cities around the world where there are differences between north and south or east and west, the authors cite that there is a difference between the north and south areas of the city, with the north containing a larger majority of the higher paid employees.
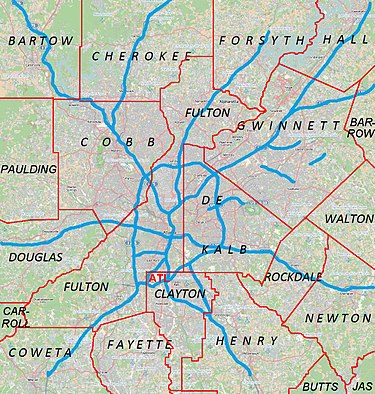
Although the survey does ask the participant for their zip code, they are asked if they either live north or south of the I-20 freeway. From this my understanding is that the authors are implying that the participant’s location either north or south could be considered as an indicator of educational standard acquired and earning potential.
So now we understand where the survey took place, why did the authors undertake the analysis? T
To answer that we can look in the first lines of the article. ‘The authors are examining the perceived threat of technological automation by some sociodemographic groups within the Altlanta Metro region’, and they do this using the 2019 survey data.
The article is separated into three sections, the first section examines the positive and negative theoretical arguments, of technological unemployment. The second section examines the methodology and the analysis of the survey data and finally concludes with some opportunities that the Atlanta Metro region could undertake to mitigate the possible impacts on the city by the increasing use of automation within businesses.
The aforementioned opportunities presented within the conclusions, although aimed at the Atlanta Metro region policymakers, could be used to mitigate the possible future impacts of continued automation within businesses, especially as some of the sociodemographics have indicated that they perceive no threat or are unaware/unprepared for the possible loss of occupation in light of automation.
So what does the research say?
The authors in section two examine at a high level the positive and negative theoretical arguments for technological automation, but start by indicating there is ‘no consensus among economists and social scientists on how the future looks like in the age of intelligent technologies or the digital economy.’ However, for some within this group of economists and social scientists, the argument is that new technologies will disrupt the labour market possibly displacing those less-skilled or less educated until they can make up the skills gap, re-locate to where the skills they have are in demand, or where none of these responses are possible the disruption would render people unemployed. Countering this, some consider that technologies will, in the long run, create multiple opportunities for growth and employment.
The authors within section three move to discuss the analysis completed within section two, and start by examining the perceptions and fears of the over 50’s, and concurring with previous research and the Pew survey that the over 50’s express that ‘technological automation will harm future jobs’ (Giegier, 2019).
This perception of the over 50’s could be observed as a skills gap, and the authors have explored this by classifying the jobs that were in high demand within the Altlanta Metro region at the time the research was being undertaken (2019) and examining the educational attainment within the age groups.
A relatively larger number of these older residents do not hold a bachelor’s degree or higher.

35% of residents of over 45 years held a bachelor’s degree or higher with 41% of 35-44 years of age group having a bachelor’s degree or higher. Through these statistics, the authors are indicating the educations attainment is greater now than it has in the past,
Are the authors also trying to indicate that as educational attainment is greater now than 40 years ago, this will also potentially reduce a negative perception of technological automation?
Building on the educational attainment information they gathered, the authors go on to investigate the low-income sociodemographic groups – supportive roles in the Atlanta Metro region have a median salary of $32,000, countered by directive or executive roles salaried at $69,000.
The authors then examine the average salaries of the supportive or non-executive occupational family roles, these being identified as being at 50% or greater risk of being technologically automated (who identified this??).

For example, in food preparation and service occupations, the median salary is $22,000, farming, fishing and forestry occupational families are salaried at $33,000, with a median of $37,000 in production occupations. Transportation and material moving $40,000, with construction salaried at $46,000.

The research also recognises that in the Black or African American sociodemographic group, technological automation is a perceived threat. This could be because of the sociodemographic characteristics (less educated, normally in support roles, or non-executive), which is supported by the statistics that 44% of Black and African Americans hold directive or executive roles but 56% are in supportive roles. Managerial and executive roles are averagely salaried at $69,000 and supportive roles averagely salaried at $32,000. This is supported by the authors indicating that of those that are employed – 33% of people identifying as Black or African Americans have a bachelor’s degree versus 54% of people identifying as White Americans.
The authors go further by comparing the different sociodemographic groups. 43% of farming, fishing, and forestry workers are Hispanic and Latino, versus 21% that are white, and 22% Black or African American. Construction is indicated to be 52% Hispanic and Latino, versus 28% white and 17% Black or African American
The results of the analysis for the Hispanic and Latino sociodemographic groups indicated that although in the low-income (and potentially in the low educational attainment group) their perception of technological automation was not negative and therefore considered to be a threat, but the Black or African American groups do recognise the perception of technological automation threat.
Why are these statistics important?
They indicate that the conventional wisdom is supported, that the greater the education level attained, the greater the possible reduction of the perceived threat of technological automation.
The analysis also implies support for The Pew survey research(Giegier, 2019), which indicates that multiple support roles like food preparation, and serving, production operations, office and administrative support, farming, fishing, forestry, transportation, and material moving, and construction fall into the 50% threat of technological automation.
In Conclusion
The perception of technological automation can be an emotive subject, how people feel about the security of their job is subjective, and personal and the perceptions of security can be based on a number of widely varying perceptions and circumstances. For example, the data entry analyst in an office may perceive a greater threat of technological automation, that a construction worker.
This may depend on several factors including communication with leadership, understanding of technological automation within their area of work, training, previous experiences, relationship with their employer, and duration of employment, to name a few.
The authors of this research make no distinction between physical technological automation and the automation of a process or set of tasks within an office environment, and so the findings although generalistic could be considered to be supportive of the continued technological automation.
The article utilises a diverse data set; age, race, education attained, housing, and location of residence within the Atlanta Metro region, with an approximately even distribution of gender, and from that, the authors indicate through their analysis that they agree with previously published research that links low-skilled and low-paid occupation families with an increased threat perception in light of implemented technological automation. However, where the authors discuss this threat perception and automation, they discuss them in this specific piece of research through occupational families, e.g. farming or forestry.
Although these are low-paid occupation families some of them can be very difficult to automate cost-effectively, although some strides have been in automation in recent years, it should be considered for the occupational family to be made completely obsolete will take some time and I believe further research is needed here.
I think the analysis within this research could be seen to fall short – it may answer some of the questions posed about the sociodemographic groups within the Atlanta Metro region and how they perceive technological automation, However, it focuses on the Black or African American, Hispanic or Latino groups and does not try to identify if White ethnic groups have the same fears or not.
Additionally, the research does not try to offer any reasoning behind why the Latino and Hispanic groups are unaware or do not care if technological automation is a threat to them.
However, it does seem that the authors have achieved their primary objective of analysing the current perceptions concerning technological automation within the sociodemographic groups within the Atlanta Metro region, identifying insights into possible opportunities Atlanta Metro region policymakers could have in reducing the impact to the local economy by technical automation.

To conclude, the research could be seen to concur with the generally agreed thinking that low-skilled, low-paid occupational families have a higher perceived threat of automation affecting their working situation, and therefore opportunities for the provision for vocational training, college, undergrad degrees and post-graduate education should be made more widely available within the region.

Potentially, the provision of such training or education might facilitate residents that have lost their vocation to extend their working life by extending their current skills base, and therefore reduce their perception of risk around the automation of tasks and technical automation more generally.
This action in response to perceived threats around technology would certainly marry with the research analysis that the more educated a person is the less they feel at risk from such advances.
Is this article worth reading? Yes, it is, Why ? because although it may not address all of the sociodemographic groups within the Atlanta Metro Region it gives a little insight into some of the perceived fears associated with technological automation, and gives clarity to the further research that is needed within this area.
Bibliography
Corporate Editors. ‘FORTUNE 500 & 1000 Companies Headquartered in Metro Atlanta’, 2020. https://www.metroatlantachamber.com/resources/most-popular/fortune-500-fortune-1000-in-metro-atlanta
‘JobsEQ’. CHMURA JobsEQ (blog), 2019. http://www.chmuraecon.com/jobseq
Ghimire, Ramesh, Jim Skinner, and Mike Carnathan. ‘Who Perceived Automation as a Threat to Their Jobs in Metro Atlanta: Results from the 2019 Metro Atlanta Speaks Survey’. Technology in Society 63 (November 2020): 101368. https://doi.org/10.1016/j.techsoc.2020.101368
Giegier, A.W. ‘How Americans See Automation and the Workplace in 7 Charts’. Pew Research Center (blog), 8 April 2019.
Next Blog
How Americans see automation and the workplace in 7 charts………..